
Special Notes:
Listen to our L&L lectures online: WHRI Lunch & Learn Series – Women’s Health Research Institute
Visit our Stats corner in the e-blast for previously published tips on data management and analysis: E-Blast Archive – Women’s Health Research Institute (whri.org)
Tip 1
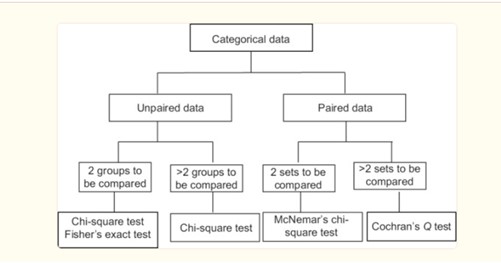
Choose the test wisely, as different types of data and the number of categories tested require different tests.
Tip 2
The well-known Pearson’s χ2 test can be used for various purposes but is suitable for unpaired data only. This test can be applied when there are two or more categories. It is commonly utilized to test for differences in distribution between two or more independent groups and assesses three types of comparison: goodness of fit, homogeneity, and independence.
- A test of goodness of fit determines whether an observed frequency distribution differs from a theoretical distribution. It is a statistical hypothesis test to ascertain whether a variable is likely to originate from a specific distribution or not, often used to evaluate if sample data is representative of the full population.
- A test for homogeneity compares the proportions of responses from two or more populations, typically utilizing Pearson’s χ2.
- A test for independence evaluates whether observations presented in the contingency table are independent from each other, checking if variables are likely to be related.
Of course there are assumptions we need to check before using the Pearson’s χ2
- The data cells should consist of frequencies or counts of cases rather than percentages or other data transformations.
- The categories should be mutually exclusive.
- Each subject in the sample can only contribute to one cell, meaning this is an unpaired test.
- It can be used for both nominal and ordinal variables.
- The values of the cell should be at least 5% or mode in at least 80% of the cells. If not, Fisher’s exact test can be used. This test is termed “exact” because the significance of the differences from the null hypothesis can be calculated precisely and does not rely on approximation.
Test for Paired Data: Tip 3
Different tests are needed for a varying number of categories compared to Pearson’s χ2, which can be used for any.
Two dichotomous variables can be compared using McNemar’s χ2 test, which generally checks for marginal homogeneity of two dichotomous variables. Note: marginal homogeneity tests whether the row and column distributions of a square contingency table have the same sample margins. It is used when you are interested in finding changes in proportion in paired data.
Assumptions:
- You must have 2 nominal (dichotomous) variables.
- Categories for each group must be mutually exclusive.
- The sample must be a random sample.
Variables with more than 2 categories for paired data can be compared using Cochran’s Q test, which can be considered a one-way ANOVA but for categorical variables. This test is an extension of McNemar’s χ2 for 3 and more categories.
Assumptions:
- Can be used for more than 2 categories.
- Categories for each group must be mutually exclusive.
- Can be used for nominal and ordinal variables.
- Groups compared are not independent – paired data.
- The sample must be a random sample.
Good luck with your Statistics adventure!
Contact Sabina for statistics help or questions here: sabina.dobrer@cw.bc.ca